The reports are structured so that you can see the high level overview at first glance and then drill down to a particular subject and individual paper.
Mean scores
The Overview provides a table showing the performance of the selected group or class on the test papers within the given suite. The scores can be displayed as marks or %.
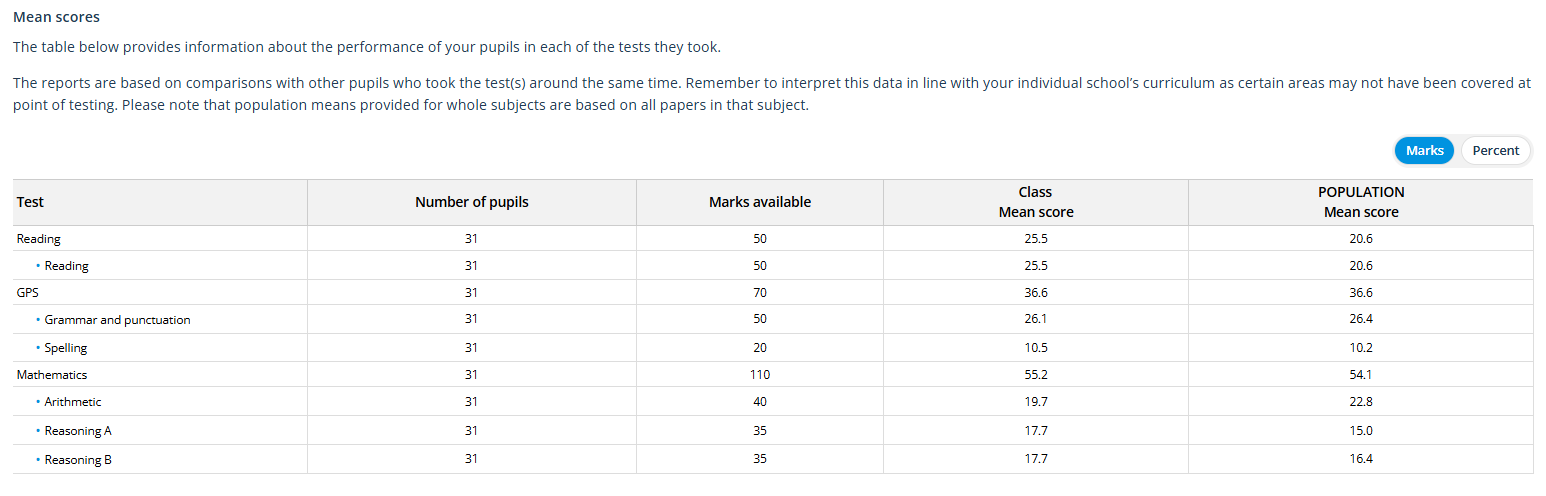
The mean score for the group is provided for each paper and subject.
Population means are only published when there are sufficient marks in the system and the mean has stabilised. This tends to happen once the number of pupils whose marks have been entered exceeds 1000.
Pupil scores
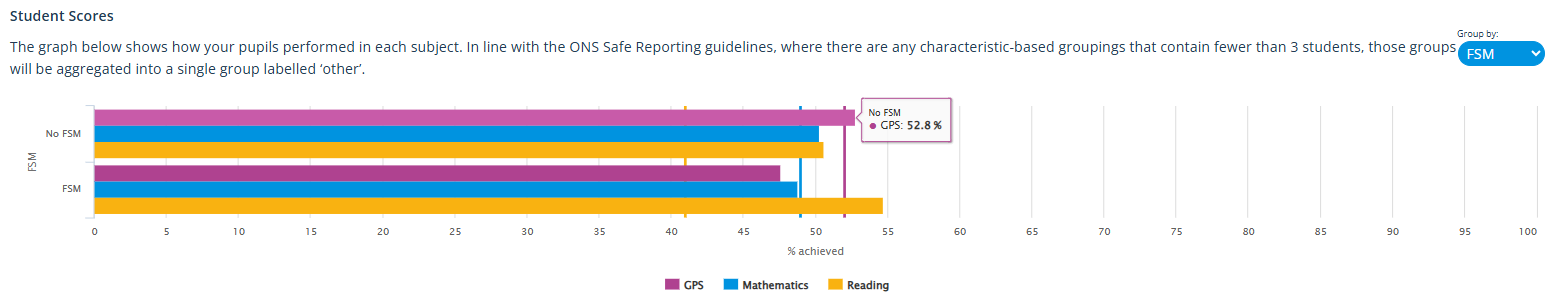
On the overview page, there is a bar chart showing the overall performance of each pupil in the group, by subject.
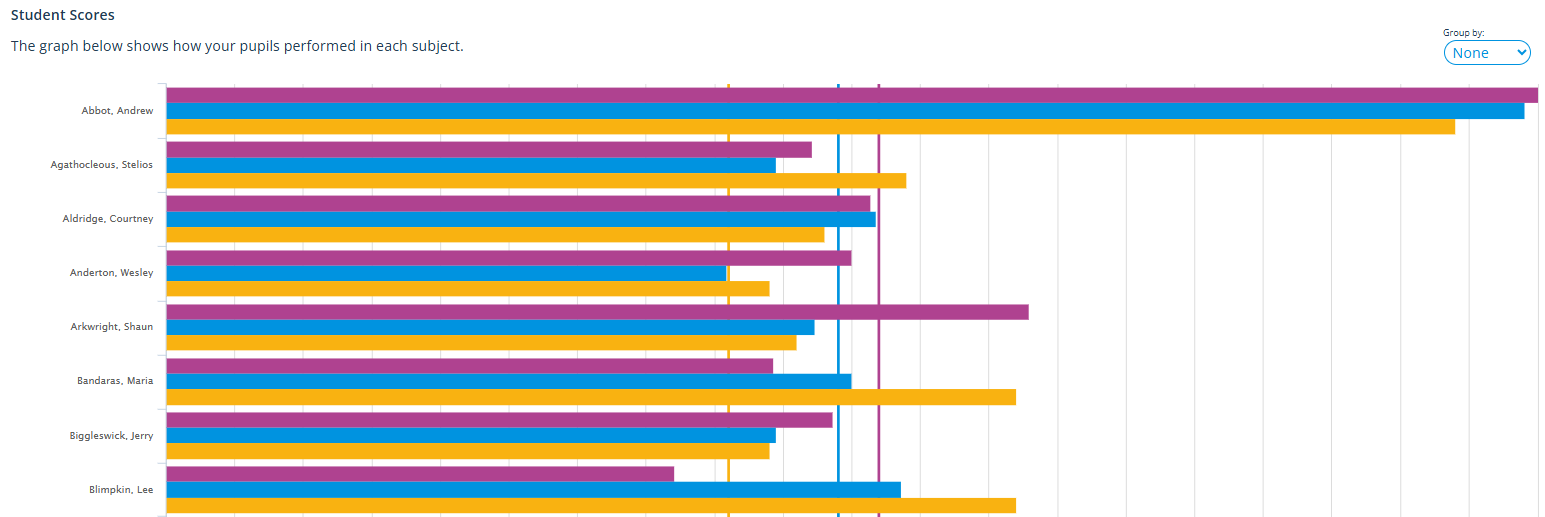

The vertical line indicates the population mean so you can see at a glance how your pupils are performing against the average.
Use the Group by drop-down list to filter by pupil demographics: