Class performance table
Options and Excel download
The last of the reports for a given test paper is a table showing the marks that each pupil scored on every question.
You can manipulate this table to change the sequence of the data and you can also download to Excel for further analysis.
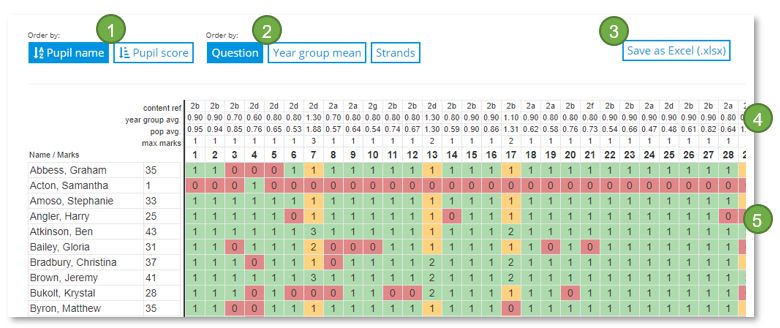
- Sort the list alphabetically by pupil name or rank by score
- The questions can be displayed sequentially, highest to lowest group mean, or by curriculum strand
- The table can be saved on your computer or network as an Excel spreadsheet
- The content reference and average mark for the group and population are displayed
- The cells indicate full marks = green; partial marks = orange; and no marks = red. Not attempted = grey